About Us
Our Portfolio
Investors
ESG
Media


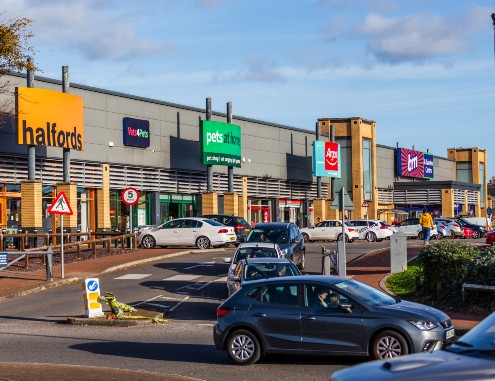
We own and actively operate a portfolio of essential everyday destinations across the UK that millions of consumers rely on week in and week out.
A mix of shopping centres and retail parks that are NewRiver-owned or managed on behalf of our capital partners, our assets are high-frequency destinations that provide affordable and well-located space that is compatible with the increasingly omnichannel strategies of retailers.
Our growth-orientated operating platform generates longer dwell times, increased transactions, stronger occupiers and high-performing partnerships that extend our reach beyond our owned estate. This translates to structurally sustainable places for our consumers and occupiers, in turn supporting attractive recurring income returns and capital growth for our shareholders.
Assets Under Management
Shopping Centres
Retail Parks
Capital Partners
Portfolio area (sq ft)
Tenancies
Annual rent
Occupancy1
Average Rent
Rent Collection
Retention Rate
of our shoppers travel less than 5km1
| Value | Portfolio Metric |
|---|---|
| £2.1 billion | Assets Under Management |
| 39 | Shopping Centres |
| 27 | Retail Parks |
| 12 | Capital Partners |
| 15 million | square feet of Portfolio area |
| 3,000 | Tenancies |
| £200 million | Annual rent |
| 95% | Occupancy |
| £13.16 psf | Average Rent |
| 99% | Rent Collection |
| 93% | Retention Rate |
| 70% | of our shoppers travel less than 5km |
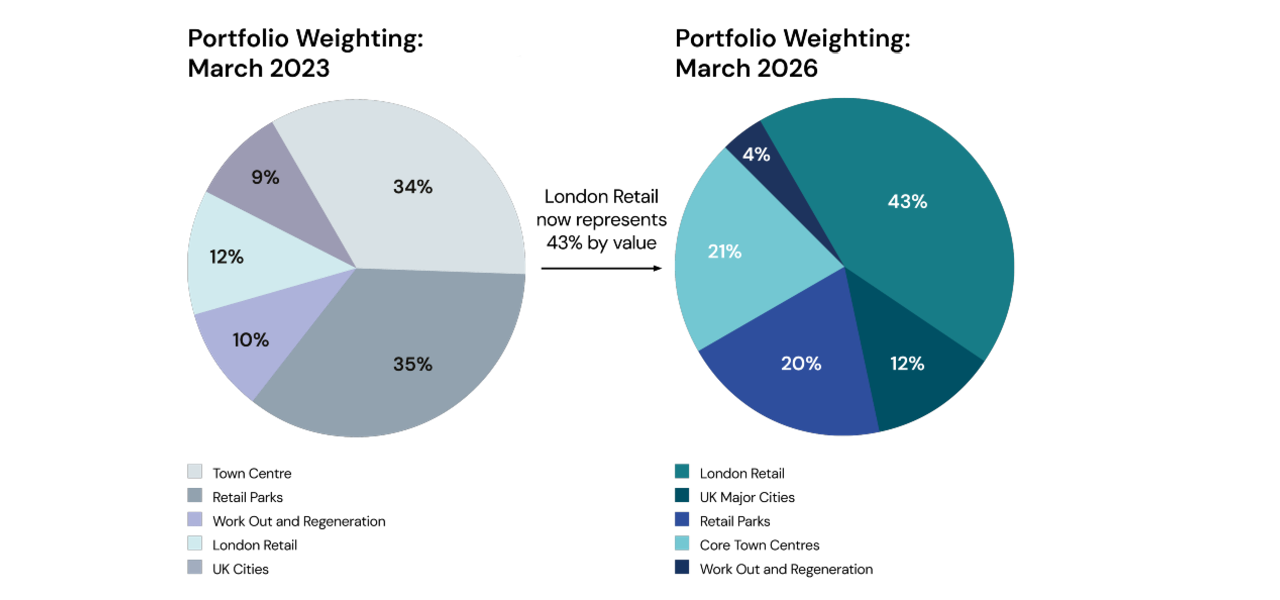
We have strategically reshaped our portfolio to where capital is concentrated, increasing our exposure to high-frequency catchments and to concentrate capital in locations where rental growth is more reliable and repeatable. These are high-frequency needs-based destinations. London Retail now represents over 40% of our portfolio by value.
London Retail: High-frequency missions, dense catchments, deep demand and tight supply
Retail Parks: Omni-channel compatible, scarce supply and clear rental growth
UK Major Cities: Regional hubs with consolidated demand
Core Town Centres: Pragmatic management and selective recycling
Work Out and Regeneration: Reducing exposure and crystallising value
Snozone: Unique, highly-profitable leisure operation
| Value | Label |
|---|---|
| 35% | Retail Parks |
| 34% | Town Centre |
| 12% | London Retail |
| 9% | Work Out and Regeneration |
| 10% | UK Cities |
| Value | Label |
|---|---|
| 43% | London Retail |
| 21% | Core Town Centres |
| 20% | Retail Parks |
| 12% | UK Major Cities |
| 4% | Work Out and Regeneration |
(Balance Sheet Assets, FY26 Results at 31 March 2026)
| Shopping Centres - Core | Retail Parks | Shopping Centres - Regeneration | Work Out and Other |
| 76% | 20% | 3% | 1% |
Our core shopping centres are high performing assets in the hearts of their local communities which exhibit resilient retail characteristics. These are assets which are already fit for purpose with affordable rents alongside a resilient local and economic backdrop for which we believe there is a strong outlook.
FY26 Results as at 31 March 2026
Occupancy
Average Rent
Rent Collection
Retention Rate
Our top occupiers across our core shopping centres are resilient household names that focus on essential goods and services, and are well positioned to cater for the non-discretionary spend of local communities.
82% of the floor area occupied by our top 100 retailers is now covered by emissions reduction commitments
| Rank | Occupier | % of NR Core Shopping Centres Rent Roll | Total Stores | Climate Commitments |
|---|---|---|---|---|
| 1 |  Boots Boots | 4.3% | 12 |  |
| 2 |  Superdrug Superdrug | 2.2% | 11 | Targeting 95% decrease in emissions by 2030 |
| 3 |  Next Next | 2.2% | 4 | |
| 4 |  M&S M&S | 2.0% | 5 | |
| 5 |  TK Maxx TK Maxx | 2.0% | 4 | |
| 6 |  Primark Primark | 2.0% | 4 | |
| 7 |  H&M H&M | 1.8% | 6 | SBTi 1.5-degree aligned targets: Net-zero by 2040 |
| 8 |  The Gym The Gym | 1.5% | 6 | SBTi 1.5-degree aligned targets: Net-zero by 2045 |
| 9 |  JD Sports JD Sports | 1.5% | 8 | SBTi 1.5-degree aligned targets: Near-term Scope 1-3 |
| 10 |  TG Jones TG Jones | 1.4% | 5 | |
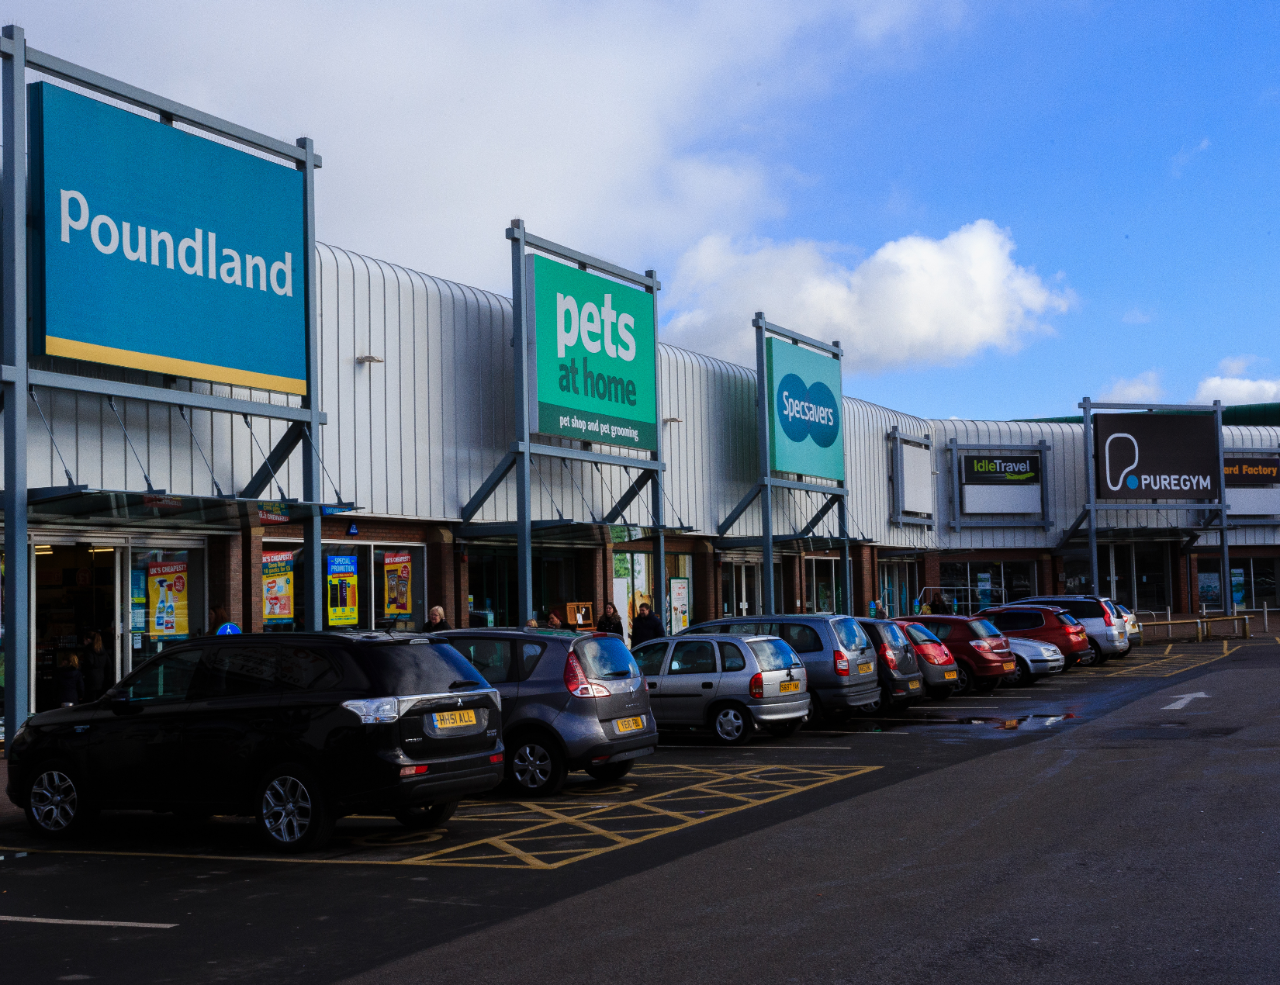
Our retail parks are quality assets that display the resilient retail characteristics that we have identified including convenience, online compatibility, liquidity and value add opportunities. From a management perspective, retail parks are cost effective with lower ESG demands and from a consumer perspective, they offer easy, accessible and free parking.
FY26 Results as at 31 March 2026
Occupancy
Average Rent
Rent Collection
Retention Rate
82% of the floor area occupied by our top 100 retailers is now covered by emissions reduction commitments
| Rank | Occupier | % of NR Retail Parks Rent Roll | Total Stores | Climate Commitments | |
|---|---|---|---|---|---|
| 1 |  B&M B&M | 11.2% | 5 | SBTi 2-degrees | |
| 2 | TK Maxx | 8.4% | 4 | | |
| 3 |  Sainsbury's Sainsbury's | 7.0% | 1 | | |
| 4 |  Matalan Matalan | 5.7% | 3 | | |
| 5 |  Aldi Aldi | 5.5% | 2 | | |
| 6 |  Halfords Halfords | 4.8% | 4 | SBTi 1.5-degrees | |
| 7 |  Iceland Iceland | 4.4% | 3 | | |
| 8 |  Pets at Home Pets at Home | 3.6% | 4 | | |
| 9 |  Currys PC World Currys PC World | 3.1% | 2 | | |
| 10 |  PureGym PureGym | 2.7% | 2 | Public commitment to net-zero and having targets formally validated by 2026 |